


Our Sustainability Performance
| 2021 | 2022 | 2023 | 2024 |
| Number of incidents of non-compliance with environmental laws and regulations | 0 | 0 | 0 | 0 |
*Figures are restated in 2024, following the improvements to the data collection systems and analysis
Our Sustainability Performance
| 2021 | 2022 | 2023 | 2024 |
| Number of incidents of non-compliance concerning product information and labeling | 1 | 0 | 0 | 0 | 0 |
| Number of incidents of non-compliance with regulations and/or voluntary codes concerning marketing communications | 0 | 0 | 0 | 0 | 0 |
| Percentage of significant product categories covered by and assessed for compliance with product information and labeling procedures (%) | 100% | 100% | 100% | 100% | 100% |
|
Number of employee lost time injuries |
4 |
0 |
8 |
25 |
5 |
|
|
Contractor lost-time injuries |
0 |
0 |
1 |
4 |
0 |
|
|
Employee lost-time injury rate (per 1 mln man-hours) |
2 |
0 |
0.6* |
1.6 |
1.2 |
|
|
Contractor lost-time injury rate (per 1 mln man-hours) |
0 |
0 |
0.30 |
1.47 |
0 |
|
|
Hours of employee health and safety training |
9,603 |
13,739 |
16,012 |
39,043 |
17,128 |
|
|
Hours of contractor health and safety training |
5,396 |
3,377 |
1,656 |
7,740 |
2995 |
|
|
Average hours of health and safety training per employee |
3 |
3 |
5 |
5 |
12 |
5 |
|
Average hours of health and safety training per contractor |
11 |
5 |
2.7 |
1.3 |
6.2 |
2.4 |
|
Employee absenteeism rate (%) |
1.70% |
1.90% |
1.75% |
1.45% |
0.99% |
1.00% |
| Number of employees | 3,181 | 3,265 | 2,957 | 3,162 | 3174 | 3343 |
| Male employees | 3,138 | 3,224 | 2,842 | 3,090 | 3052 | 3192 |
| Female employees | 43 | 41 | 49 | 72 | 95 | 151 |
| Full time, male employees | 2,908 | 3,090 | 3052 | 3192 | ||
| Full time, female employees | 49 | 72 | 95 | 151 | ||
| Part time, male employees | 0 | 0 | 0 | 0 | 0 | 0 |
| Part time, female employees | 0 | 0 | 0 | 0 | 0 | |
| Senior management employees | 22 | 24 | 41 | 43 | 50 | 51 |
| Middle management employees | 136 | 151 | 175 | 197 | 271 | 334 |
| Non-management employees | 2,959 | 3,090 | 2,741 | 2,965 | 2826 | 2958 |
| New employee hires | 563 | 730 | 573 | 608 | 432 | 463 |
| New employee hires, age 18-30 | 343 | 505 | 369 | 410 | 294 | 278 |
| 60.9% | 69.2% | 54.0% | 67.4% | 68.1% | 60.0% | |
| New employee hires, age 31-50 | 220 | 220 | 201 | 198 | 135 | 180 |
| 39.1% | 30.1% | 35.1% | 32.6% | 31.3% | 38.9% | |
| New employee hires, age 51+ | 0 | 5 | 3 | 0 | 3 | 5 |
| 0% | 0.7% | 0.5% | 0.0% | 0.7% | 1.1% | |
| New employee hires, male | 554 | 723 | 557 | 581 | 398 | 402 |
| 98.4% | 99.0% | 97.2% | 95.6% | 92.1% | 86.8% | |
| New employee hires, female | 9 | 7 | 16 | 27 | 34 | 61 |
| 1.6% | 1.0% | 2.8% | 4.4% | 7.9% | 13.2% | |
| Voluntary employee turnover | 684 | 661 | 300 | 205 | 196 | 186 |
| 21.5% | 20.2% | 10.1% | 6.6% | 6.2% | 5.6% | |
| Voluntary employee turnover, age 18-30 | 297 | 363 | 165 | 117 | 113 | 107 |
| 43.4% | 54.9% | 55.0% | 57.1% | 57.7% | 57.5% | |
| Voluntary employee turnover, age 31-50 | 362 | 293 | 131 | 87 | 83 | 78 |
| 52.9% | 44.3% | 43.7% | 42.4% | 42.3% | 41.9% | |
| Voluntary employee turnover, age 51+ | 25 | 5 | 4 | 1 | 0 | 1 |
| 3.7% | 0.8% | 1.3% | 0.5% | 0.0% | 0.5% | |
| Voluntary employee turnover, male | 674 | 654 | 294 | 202 | 187 | 177 |
| 98.5% | 98.9% | 98.0% | 98.5% | 95.4% | 95.2% | |
| Voluntary employee turnover, female | 10 | 7 | 6 | 3 | 9 | 9 |
| 1.5% | 1.1% | 2.0% | 1.5% | 4.6% | 4.8% | |
| Female employment rate (%) | 1.4% | 1.3% | 1.7% | 2.3% | 3.0% | 4.5% |
| Women in senior management | 6 | 6 | 6 | 9 | 11 | 8 |
| 27.3% | 25.0% | 14.6% | 20.9% | 22.0% | 15.7% | |
| Women in middle management | 18 | 18 | 16 | 24 | 36 | 39 |
| 13.2% | 11.9% | 9.1% | 12.2% | 13.3% | 11.7% | |
| Women in non-management positions | 19 | 19 | 27 | 39 | 48 | 101 |
| 0.6% | 0.6% | 1.0% | 1.3% | 1.7% | 3.4% | |
| Board seats occupied by women | 0 | 0 | 0 | 0 | 0 | 3 |
| 0% | 0% | 0% | 0% | 0% | 0% | |
| Number of employees with a disability | 55 | 55 | 57 | 95 | 96 | 97 |
| Number of formal incidents of discrimination reported | 0 | 0 | 0 | 0 | 0 | 97 |
| Percentage of working time lost due to industrial disputes, strikes and/or lock-outs (%) | 0 | 0 | 0 | 0 | 0 | 0 |
| Number of female employees entitled to maternity leave | 2 | 4 | 2 | 1 | 4 | 6 |
| Number of female employees that took parental leave | 2 | 4 | 2 | 1 | 3 | 4 |
| Number of female employees that returned to work in the reporting period after parental leave ended | 1 | 3 | 1 | 1 | 3 | 3 |
| Number of female employees that returned to work after parental leave ended that were still employed 12 months after their return to work | 0 | 1 | 1 | 1 | 3 | 6 |
| Female employee return to work rate of employees that took parental leave (%) | 50% | 75% | 50% | 100% | 100% | 75% |
| Female employee retention rate of employees that took parental leave (%) | 0% | 25% | 50% | 100% | 100% | 150% |
| Total hours of training provided | 28,701 | 37,230 | 18,872 | 22,300 | 45,233 | 45200 |
| Average hours of training per employee | 9.0 | 11.4 | 6.4 | 7.1 | 14.3 | 13.5 |
| Percentage of employees receiving regular performance and career development reviews (%) | NIA | NIA | 100% | 100% | 100% | 100% |
Total CSR Spending ( ) ) |
N/A | 23,329 | 200,000 | 175,000 | 504,000 | 535411 |
| Number of school and university visitors hosted | N/A | 735 | 27 | 85 | 400 | 200 |
| School bag donations (Number of bags donated to students) | N/A | 20,000 | N/A | N/A | N/A | N/A |
| Hours of employee volunteering | N/A | 800 | N/A | N/A | N/A | N/A |
*Figures are restated in 2024, following the improvements to the data collection systems and analysis
Our Sustainability Performance
| 2021 | 2022 | 2023 | 2024 |
|
Water withdrawal (m3) |
1,117,040 |
1,221,571 |
1,603,872 |
1,846,224 |
1,916,762 |
1,925,470 |
|
Water recycling and reuse (m3) |
739 |
73,000 |
0 |
216,000 |
2,10,000 |
230,000 |
|
Percentage of water recycled and/or reused (%) |
0.1% |
6.0% |
0.0% |
11.7% |
11.0% |
11.9% |
|
Total water consumption (m3) |
1,117,779 |
1,294,571 |
1,603,872 |
2,062,224 |
2,126,762 |
2,155,470 |
|
Water discharge (m3) |
657,706 |
NIA |
697,966 |
952,000 |
952,000 |
1,391,454 |
|
Manufacturing water intensity (m3/metric ton of finished product) |
3.1 |
3.7 |
3.7 |
3.3 |
3.5 |
3.4 |
| Percentage of card board coming from recycled materials used as an input material (%) | 57% | 70% | 72%* | 73%* | 72% | 73% |
| Plastics removed from packaging (tons) | NIA | NIA | N/A | N/A | N/A | N/A |
| Paper removed from packaging (tons) | NIA | NIA | N/A | N/A | N/A | N/A |
| Total packaging removed from the consumer waste stream (tons) | NIA | NIA | N/A | N/A | N/A | N/A |
| Direct stationary energy usage (in thousands kWh) | 53,690 | 64,787 | 46,579* | 74,853* | 75,529 | 64,155 |
| Indirect stationary energy usage (in thousands kWh) | 53,079 | 66,436 | 67,147 | 68,570 | 71,266 | 71,512 |
| Total stationary energy usage (direct and indirect, in thousands kWh) | 106,768 | 131,223 | 113,726 | 143,423* | 146,794* | 135,667 |
| Total solar energy usage (in thousand kWh) | 0 | 0 | 8,071 | 12,137 | 12,340 | 11,830 |
| Percentage of electricity consumption from solar (%) | 0 | 0 | 7% | 8% | 8% | 9% |
| Almarai owned refrigerators in stores (in thousands kWh) | NIA | NIA | N/A | N/A | N/A | N/A |
| Manufacturing energy intensity (kWh/metric ton of finished product) | 283.1 | 398.6 | 256.2 | 256.8* | 264.8* | 238.1 |
| Total vehicle fuel consumption (thousands of liters) | 3,774 | 2,793 | 1,374 | 2,710* | 3,082* | 2,938 |
| Scope 1 (direct) emissions (metric tons CO2e) | 19,879 | 18,061 | 25,880 | 27,771* | 37,073* | 40,113 |
| Scope 2 (indirect) emissions (metric tons CO2e) | 23,188 | 29,022 | 29,333 | 27,397* | 31,132* | 33,819 |
| Scope 3 emissions from Almarai refrigerators in stores (metric tons CO2e) | NIA | NIA | NIA | N/A | N/A | N/A |
| Total emissions (metric tons CO2e) | 43,067 | 47,083 | 55,213 | 55,168* | 68,206* | 73,931 |
| Manufacturing emissions intensity (metric tons CO2e/metric ton of finished product) | 0.10 | 0.13 | 0.13 | 0.08 | 0.22* | 0.08 |
| Emissions from refrigerant leakage and replacement (metric tons CO2e) | 23 | 286 | 1,166 | 1,627* | 1,635* | 1,267 |
| Food waste resold for animal feed (Store returns and operational) (metric tons) | 0 | 0 | 0 | 0 | 0 | 0 |
| Recycled waste (metric tons) | 15,040 | NIA | 9,042 | 4,250 | 3,826 | 2,772 |
| Total waste generated (metric tons) | 24,240 | 4,894 | 19,395 | 22,702 | 21,940 | 20,702 |
| Waste sent to landfill (metric tons) | 9,200 | 4,894 | 10,353 | 11,295 | 11,100 | 10,010 |
| Percentage of waste sent to landfill (%) | 38% | NIA | 53% | 53%* | 51% | 48% |
*Figures are restated in 2024, following the improvements to the data collection systems and analysis
Our Sustainability Performance
| 2021 | 2022 | 2023 | 2024 |
|
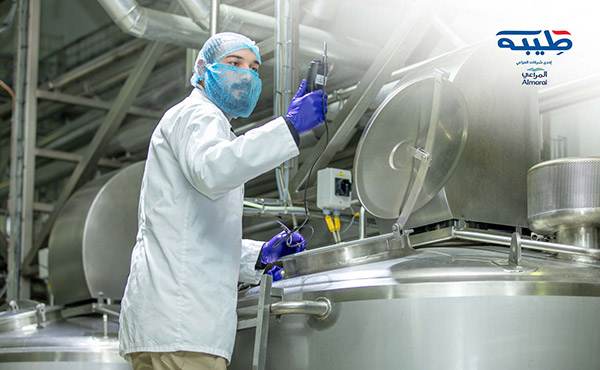
Percentage of production volume manufactured in sites certified by an independent third party according to internationally recognized food safety management system standard (%) |
85 |
100% |
100% |
100% |
100% |
|
|
Number of incidents of non-compliance with regulations and/or voluntary codes concerning the health and safety impacts of products and services |
0 |
0 |
0 |
0 |
0 |
0 |
|
Number of recalls |
0 |
0 |
0 |
0 |
0 |
0 |
|
Percentage of significant product categories covered by and assessed for compliance with product information and labeling procedures (%) |
100% |
100% |
100% |
100% |
100% |
100% |
|
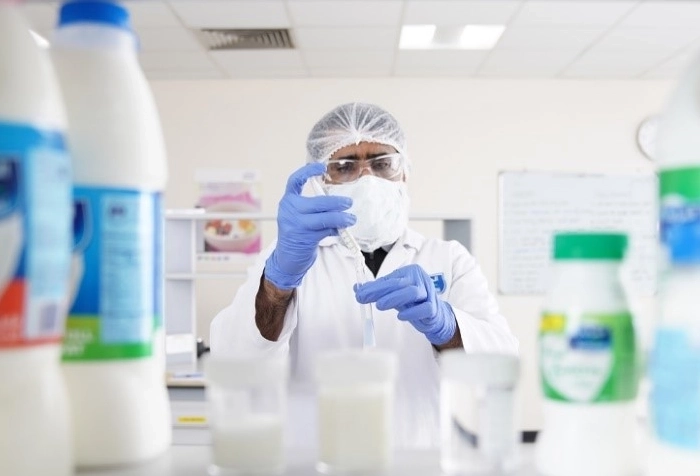
Percentage of products which health and safety impacts are assessed for improvement (%) |
100% |
100% |
100% |
100% |
100% |
100% |
|
Total number of manufacturing plants |
1 |
2 |
2 |
2 |
2 |
2 |
|
Number of Food Safety System Certification (FSSC) 22000 certified plants |
1 |
1 |
2 |
2 |
2 |
2 |
|
Number of Global Food Safety Initiative (GFSI) certified plants |
1 |
1 |
2 |
2 |
2 |
2 |
|
Percentage of plants that are GFSI certified (%) |
100% |
100% |
100% |
100% |
100% |
100% |
|
Number of food safety and quality assurance employees |
72 |
72 |
72 |
94 |
93 |
93 |
| Number of cows | N/A | N/A | N/A | N/A | N/A | N/A |
| Number of chickens processed | N/A | N/A | N/A | N/A | N/A | N/A |
| Number of incidents of non-compliance with laws regulations, and adherence with voluntary standards related to transportation, handling, and slaughter practices for live terrestrial and aquatic mammals | N/A | N/A | N/A | N/A | N/A | N/A |
| Percentage of cows in enclosed housing with resting areas (%) | N/A | N/A | N/A | N/A | N/A | N/A |
| Percentage of chickens in enclosed cage free housing (%) | N/A | N/A | N/A | N/A | N/A | N/A |
| Percentage of locally based suppliers engaged (%) | 81% | 69% | 59% | 41%* | 44% | 51% |
| Percentage of spending on locally based suppliers (%) | 40% | 69% | 71% | 68% | 69% | 68% |
| Total number of suppliers engaged | 588 | 111 | 75 | 374* | 392 | 505 |
| Total number of local suppliers engaged | 478 | 77 | 44 | 154* | 172 | 259 |
| Percentage of purchased volume from suppliers compliant with company's sourcing policy | NIA | 100% | 99% | 100% | 100% | 100% |
| Percentage of purchased volume, which is verified as being in accordance with credible, internationally recognized responsible production standards | NIA | 100% | 100% | 100% | 100% | 100% |
| New suppliers that were screened using social and/or environmental criteria | 0 | 0 | 3 | 0 | 0 | 0 |
| Number of negative social and/or environmental impacts in the supply chain and actions taken | NIA | NIA | 0 | 0 | 0 | 0 |
*Figures are restated in 2024, following the improvements to the data collection systems and analysis